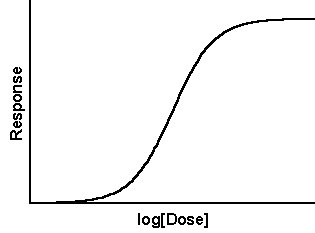
This is a sigmoidal curve. It represents a system where something happens (y axis) as something is increased (x axis). In the case of the ELISA assay, we could be looking at an increase in absorbance as an antibody concentration is increased. Perhaps we're looking at the HIV ELISA. How can we describe the development of this assay?
Bob Gallo describes it without the useful graph. In 1984 they reported their assay as:
"100% of the AIDS sera were scored positive...84% of the lymphadenopathy patients were found to have serum antibodies to HTLV-III... 21% of healthy homosexual men with an increased risk of AIDS were also positive. No heterosexual controls... had antibodies to HTLV-III. The results strongly indicate that the antibodies to HTLV-III are diagnostic of AIDS or indicate significant risk of the disease, and suggest that HTLV-III is the primary cause of human AIDS."
The Gallo approach appears to be to test people using the ELISA assay. A signal equals HIV. So, if there serum produces a signal on the ELISA they have HIV which corralates with their illness (AIDS). That's not unreasonable, but what about the actual data? What is the cut off signal for a positive and negative signal? Midway up the sigmoidal curve? Let's add another curve to the chart the represents the negative patients blood serum.
The amount of protein in the sera can cause background signal. As you dilute the sera you will reduce the signal. On the sigmoidal curve chart we add a negative curve. It stays with the sigmoidal curve (moving from x and y equal zero) until that curve starts to rise. The negative curve stays close to the base line but gradually slopes up where it will again meet up with the sigmoidal curve. At this point in the x axis we are experiencing false negatives.
Using these two curves we can thus define the false negative and a false positive as points on the x axis. That means at some dilution of blood serum both HIV positive and HIV negative people will give the same signal. There will be a range in between these two point where negative and positive sera can be distinguished. The ideal concentration (dilution) will be where the positive signal has plateaued and the negative signal has not begun to rise. Since this is not the range where you will get false positives or false negatives it can be called the positive positive/positive negative range or ++/+- range. The x axis represents concentrations. They can thus be defined in the following manner
False negative: When positive control give no signal. --
False positive: When negative control gives a signal. -+
Positive positive: When positive control gives a signal ++
Positive negative: When negative control gives no signal +-
at concentrations A, B, C, D, E, F, and G
Positive control A-- B-- C++ D++ E++ F++ G++
Negative control A+- B+- C+- D+- E+- F-+ G-+
We can define our useful ELISA assay range as concentrations C, D and E.
The single data point ELISA followed up with a corralation to AIDS patients and a negative control group is not rigorous science. The assay development should begin by defining the positive and negative curves. Then you can think about changing a blocking buffer perhaps. Does it separate the ++/+- range further? Every tweak to the system must strive for that result. You are trying to get the ++ part to start as soon as possible along the x axis. That means you want to make the ELISA highly sensative to HIV antibodies. You want the false positive signal (-+) to start as late as possible. That means you want the assay to not be sensative to background proteins.
You will find yourself in meetings where Cargo Cult Scientists gather to discuss ELISAs. They will each have a repertoire of buzzwords for buffers, plate readers, plate washers, conjugated antibodies, substrates and graphing software. No one will talk about the curves. But it is the curves that explains how each change in buffers, plate readers and so on, will affect the system you are tying to set up.
No comments:
Post a Comment